Multi-Stage Pump High Vibration Issues - Vibration Analysis
- Nitheesh Abdul Rahman
- Sep 27, 2024
- 4 min read

*Sample image as photography was prohibited on site
Case History - Vibration Analysis & Troubleshooting of Pump
High vibration on a large centrifugal pump was detected during a high-load test of a pump during routine offline vibration analysis service.
The pump, even though installed long back was never operated at this higher RPM and load range due lower to production demands.
The site team also reported minor damage to the SBCs and coolant pipes when operating the pump for longer periods at this higher capacity.
Data Collection
Initially, offline data was collected to assess the machine condition.
The proximity probe vibration from the pump was well within the limits and below 22 Microns 0-Pk.
Initial casing vibration measurement from pump showed casing vibration values around 27 mm/s RMS, especially at the Pump NDE side.
It was clear further analysis was required to identify the issue.
16 Channel DAQ was set up to collect the vibration data from Motor and all the pump points simultaneously.
A tachometer was also installed to measure the RPM.
Run-up / Coast-Up Tests - Bode Plot Analysis
Run-up data was taken from the pump and the pump was taken from 0 RPM to 2410 RPM (Maximum RPM, based on flow conditions during the data collection).
The highest vibration amplitude was observed on the Pump NDE Vertical when the machine reached 2260 RPM and had a maximum amplitude of 27 mm/s RMS.
As the machine's speed was increased to 2410 RPM, the vibration values were reduced to 22 mm/s RMS.
While there was an increase in casing vibration values, no significant increase in vibration amplitudes was observed from the proximity probe system.
The dominant frequency observed is due to 7X (Vane Pass Frequency). This is from the pump impeller with 7 Vanes.
The vibration spectrum from the pump even at relatively low RPM, around 700-1200 RPM, shows dominant vibration frequencies in the region of 260 Hz. This can be due to resonance at that frequency region.
As the pump RPM is increased, the Vane Pass Frequency (7X) also increases and becomes near the resonance frequency region (at 2260 RPM, VPF= 263 Hz) and the vibration amplitudes from VPF get amplified significantly. This can be seen in the cascade plot attached below.

As the RPM was increased, the VPF matched with the resonance frequency or natural frequency and vibration got amplified significantly. This could be clearly seen from spectra collected at different RPM's


The 1X Filtered Bode plot did not show any increase in 1X amplitudes as the RPM is varied, and is well below 0.3 mm/s throughout the operating RPM.
The 7X Filtered run-up plot showed a significant increase in amplitude as the RPM reached 2269 RPM, with a phase change of around 80 degrees. Indicating a clear case of resonance

Bode Plot - Run-Up Data of 7X Frequency Vibration data measured on the Pump NDE Bearing shows an increase in vibration amplitudes as distance increases from the pump casing, indicating a bending movement of the bearing casing (the bearing casing is cantilever supported on the pump casing).
Bump Tests
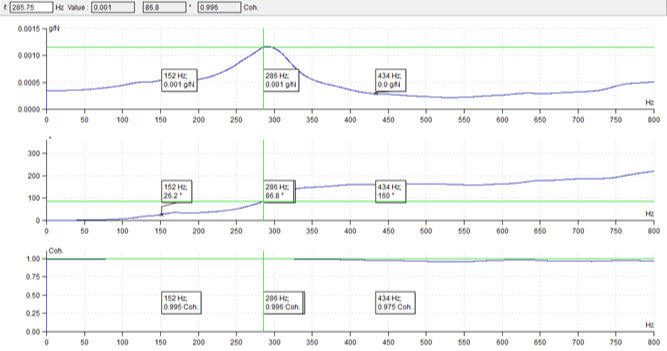
To confirm the presence and nature of resonance/natural frequency. Impact or Bump Test was conducted using a modally tuned hammer.

Bump test results showed a clear peak at 285 Hz with phase change as expected of resonance.
At a higher RPM range, the vane pass frequency coincided with this resonant frequency.
The results were forwarded to the client and the case was discussed with Pump OEM to find a solution.
Actions
Two weights were added to the Pump DE and NDE bearings as recommended by Pump OEM.
Data was collected after the above modifications.
Run-up data was taken from the pump and the pump was taken from 0 RPM to 2431 RPM (Maximum RPM, based on flow conditions during the data collection).
The vibration values were much lower compared to the initial data during the run-up with maximum amplitudes observed at Pump NDE Horizontal at 2355 RPM (5.5 mm/s RMS) and Pump DE Vertical at 2299 RPM (4.2 mm/s RMS)
The 1X Filtered Bode plot does not show any significant increase in 1X amplitudes as the RPM is being varied, with a maximum below 0.4 mm/s RMS.
At full speed the vibration levels are significantly lower than the initial readings with maximum vibration observed on the Pump NDE in the Horizontal direction (4.3 mm/s RMS) and the vertical readings were 3.3 mm/s RMS
At Pump NDE the maximum vibration was 3.6 mm/s RMS on Pump DE Horizontal and 3.3 mm/s RMS in Vertical direction.
Spectrum from Pump DE and NDE shows 3X and 7X as dominant frequencies. The amplitudes are within acceptable limits.

Vibration trend from Pump after the modifications showing vibration values less than 6 mm/s RMS at all frequency / RPM ranges

2398 RPM – BEFORE MODIFICATION
Overall [RMS] | 1X [RMS] | 1X Ph | 7X [RMS] | 7X Ph | |
MOTOR NDE VER | 1.5 | 0.8 | 115.0 | 1.1 | 275.6 |
MOTOR NDE HOR | 3.5 | 3.4 | 165.9 | 0.0 | 32.6 |
MOTOR NDE AXI | 1.4 | 1.0 | 280.4 | 0.7 | 70.4 |
MOTOR DE VER | 1.6 | 1.1 | 163.7 | 0.8 | 161.3 |
MOTOR DE HOR | 4.0 | 4.0 | 160.5 | 0.1 | 209.4 |
MOTOR DE AXI | 1.9 | 0.8 | 355.0 | 0.2 | 164.0 |
PUMP DE VER | 4.0 | 0.4 | 125.5 | 3.2 | 207.3 |
PUMP DE HOR | 4.2 | 3.2 | 335.4 | 0.6 | 117.3 |
PUMP DE AXI | 1.2 | 0.4 | 179.1 | 0.0 | 264.3 |
PUMP NDE VER | 27.2 | 0.1 | 229.0 | 26.4 | 252.9 |
PUMP NDE HOR | 4.9 | 2.5 | 313.8 | 3.4 | 45.1 |
PUMP NDE AXI | 1.5 | 0.6 | 348.8 | 0.9 | 94.8 |
2320 RPM – AFTER MODIFICATION
OvB AS [RMS] | 1X [RMS] | 1X Ph | 7X [RMS] | 7X Ph | |
MOTOR NDE VER | 1.8 | 0.5 | 106.5 | 1.5 | 205.9 |
MOTOR DE VER | 1.1 | 0.7 | 166.3 | 0.3 | 311.0 |
PUMP DE VER | 2.7 | 0.2 | 46.6 | 2.1 | 286.8 |
PUMP DE HOR | 3.5 | 1.1 | 304.8 | 2.3 | 130.0 |
PUMP DE AXI | 2.3 | 0.3 | 160.3 | 1.6 | 89.9 |
PUMP NDE VER | 2.9 | 0.1 | 267.4 | 2.0 | 132.1 |
PUMP NDE HOR | 2.9 | 1.4 | 250.1 | 0.5 | 155.9 |
PUMP NDE AXI | 1.8 | 0.3 | 327.0 | 0.4 | 277.8 |
Results showed a drastic reduction in vibration values after the modification.
This case also showed us that it is essential to take casing vibration even on machines with journal bearings and proximity probes as some vibrations may not be visible in the proximity probe system.


Comments